We run our website at kaboom.org on a custom-built Rails 4-based CMS and for a long time I was unhappy with performance of the site. Not that it wasn’t responsive and a huge (and I mean HUGE) improvement over the previous drupal mess, but requests were spending more time than seemed necessary just in the ruby layer. Most requests were spending almost 500ms there according to NewRelic traces.
I installed some tools locally to help track down where and why it was spending
so much time each request. The gem rack-mini-profiler got me started and it is
a great way to get data on each and every request.
This helped me track down some code that was dynamically creating store_accessors for every request. There is an easy way to check if a
given stored_attribute exists on a class:
1
| |
Implementing this check and only adding the store_accessors when needed provided a small performance increase but each request was still spending way too much time in ruby. I spent some time trying to get usable data from flamegraphs and also experimented with adding ‘step’ blocks in my code to help track down where things were slow. The problem I found with rack-mini-profiler was that the rails stack is so deep it makes it very hard to see exacty where the problems are. I still have it installed on a local branch that and I find it very useful in some cases. But for this issue, it left me digging through a convoluted flame graph and I decided to move on.
It was at this point I took a few weeks off from profiling and also took a vacation. Several weeks later I was preparing for a bug day and was getting error traces from New Relic to add to Trello that I revisited the performance issues. We are on Heroku so I decided to switch our free New Relic plan to the plan the provides the paid-level features for a limited number of dynos. What this gave me was access to my new favorite profiling tool: the New Relic thread profiler. I ran the tool for a 5 minute trace and this was the result:
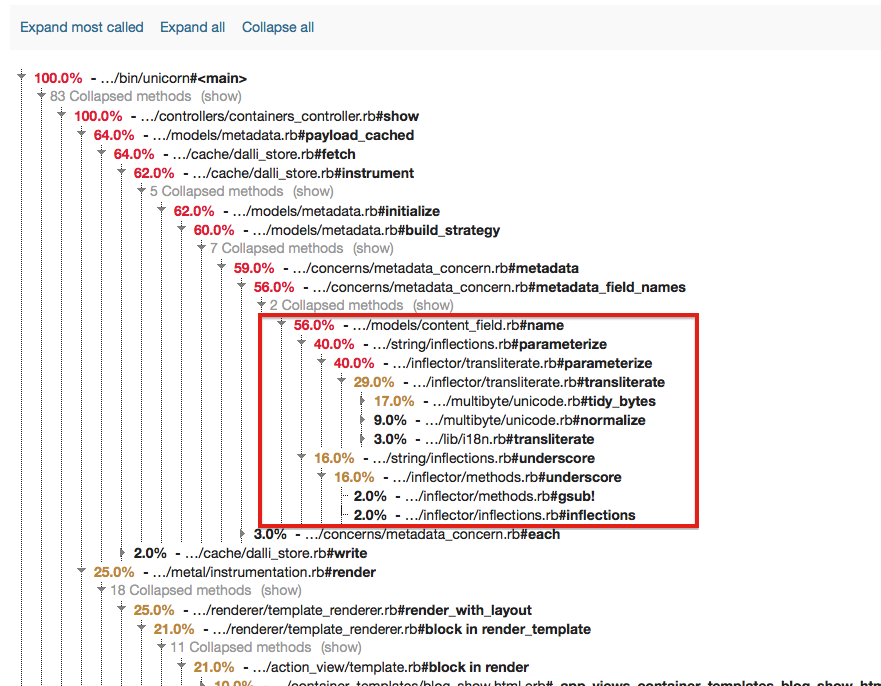
I had to uncollapse a few parts of the tree but it’s pretty clear that the request was spending over 56% of the time in the name method on the ContentField model. Which, as it turns out, was a method that was no longer even needed. The offending, extraneous code:
1 2 3 4 | |
I think this was added in the initial phases of building our CMS to ensure conformity with seeded names alongside imported field names from Drupal. The drupal importer I wrote handled all the transformations and there are validations so enure that field names are created properly. This method does nothing at all except run downcase, parameterize, and underscore on strings that already conform to that format. And, as it turns out, inflectors don’t come cheap. I removed the method, ran my tests, and deployed a new version of the CMS. The performance increase was noticable immediately:
![]()
It’s not everyday that removing 4 lines of code (well, it was really just one) can give you such a boost in performance. Lessons learned:
- Careful with those inflectors! They can end up being performance bottlenecks.
- Just because it was cached in memcache doesn’t mean the object initialization doesn’t incur the same cost.
- NewRelic thread profiling is pretty awesome
- rack-mini-profiler combined with flame graphs is an incredible tool that I need to spend more time learning how to use properly.
- Careful with adding dynamic stored attributes with an after_initialize. They get added as class methods so only need to be added once.
Helpful links: